Access an Overview
Overview offers a visual representation of your progress toward your degree. This button is located next to the What-If Report button on the dashboard. The Overview page includes the following graphs/tables:

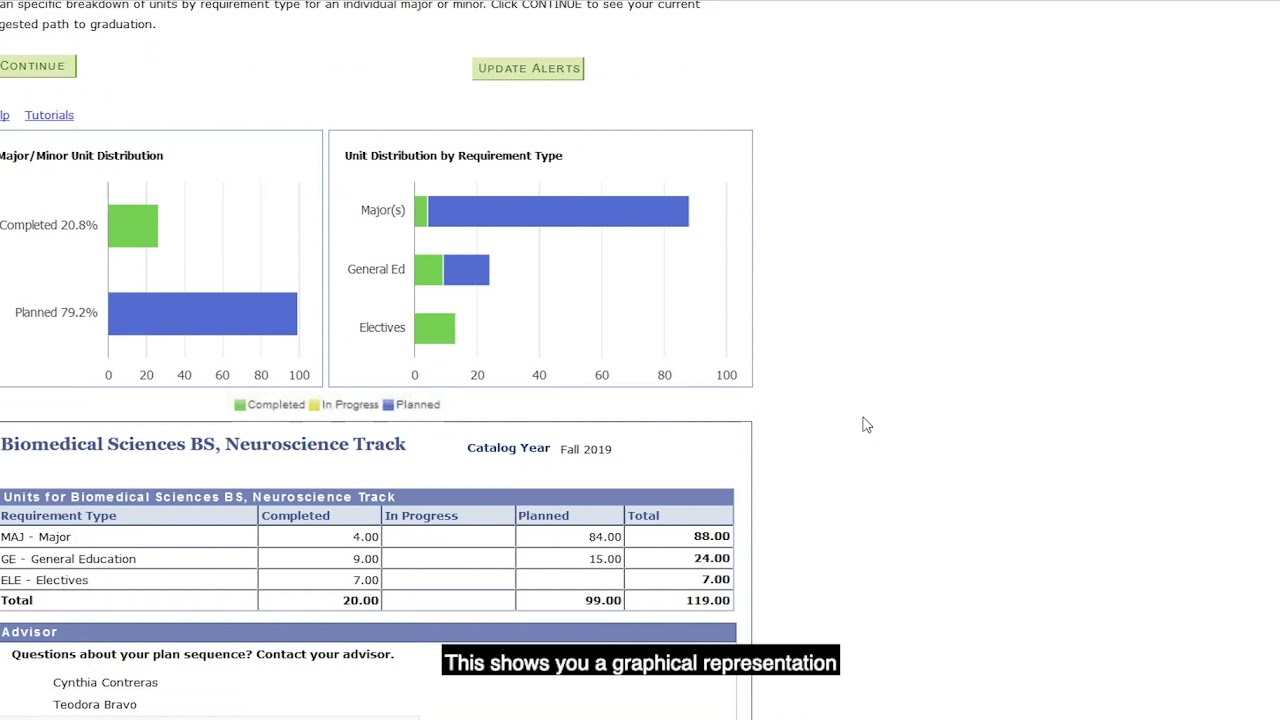
The graph to your left displays your:
- Completed units
- In progress units
- Units remaining
The graph to your right displays a breakdown of your units based on the requirement for your degree type such as:
- Major
- General education
- Electives
Below these two graphs, you’ll see a numerical breakdown of the same information.
If your degree program includes additional requirements that you must fulfill, you’ll see a table with the related information. For example, your degree program might require an additional pre-requisite math course.

To return to the dashboard, click continue at the bottom of the page.